Blog Layout

Creating attribute/metric selectors in ThoughtSpot

Mar 17, 2023

Parameters in ThoughtSpot are tremendous and can be used in many different ways.


One of my favorites is switching attributes and metrics without needing the SQL to be re-generated.


Let me show you how I do it:


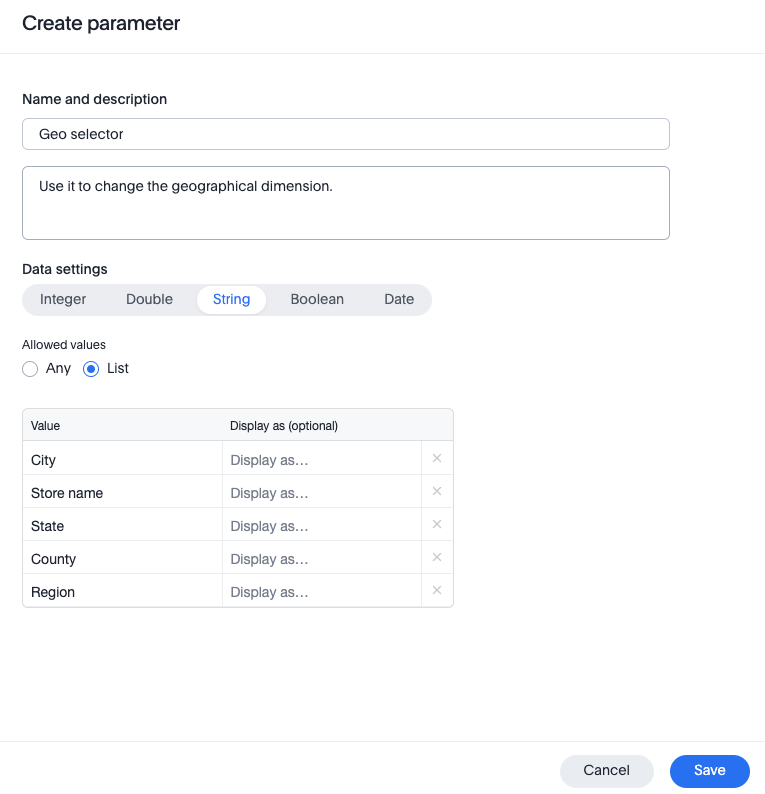
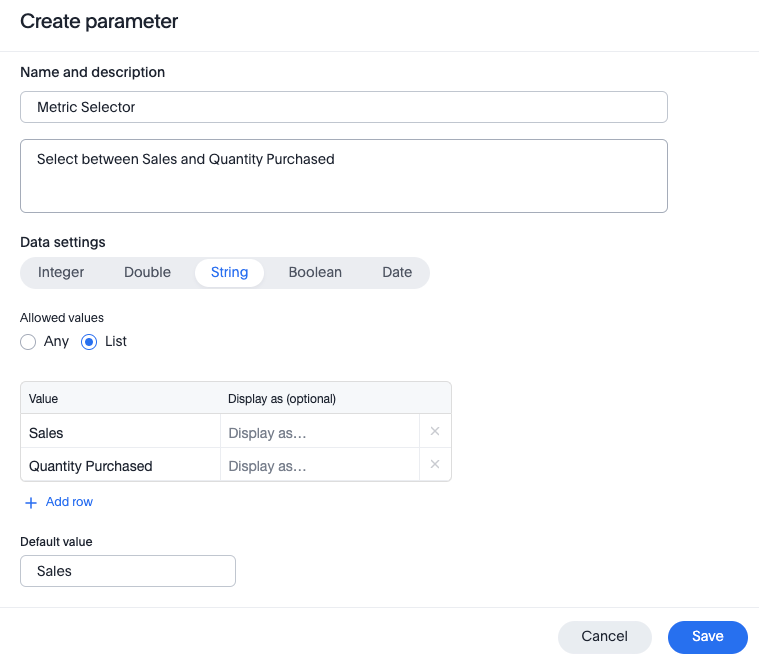
  1. Create a worksheet and add two new parameters—one for the attributes and the other for the metrics.


Geo Selector:


Metric Selector:


     2.   Create a new search and 2 new formulas like this:


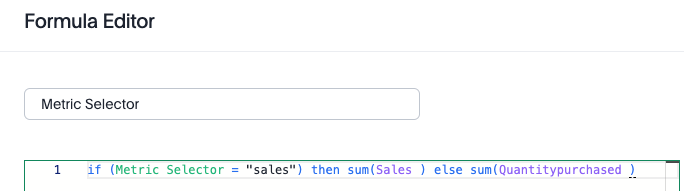
if (Metric Selector = "sales") then sum(Sales ) else sum(Quantitypurchased )


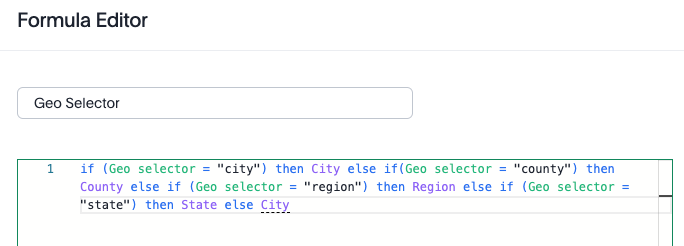
if (Geo selector = "city") then City else if(Geo selector = "county") then County else if (Geo selector = "region") then Region else if (Geo selector = "state") then State else City


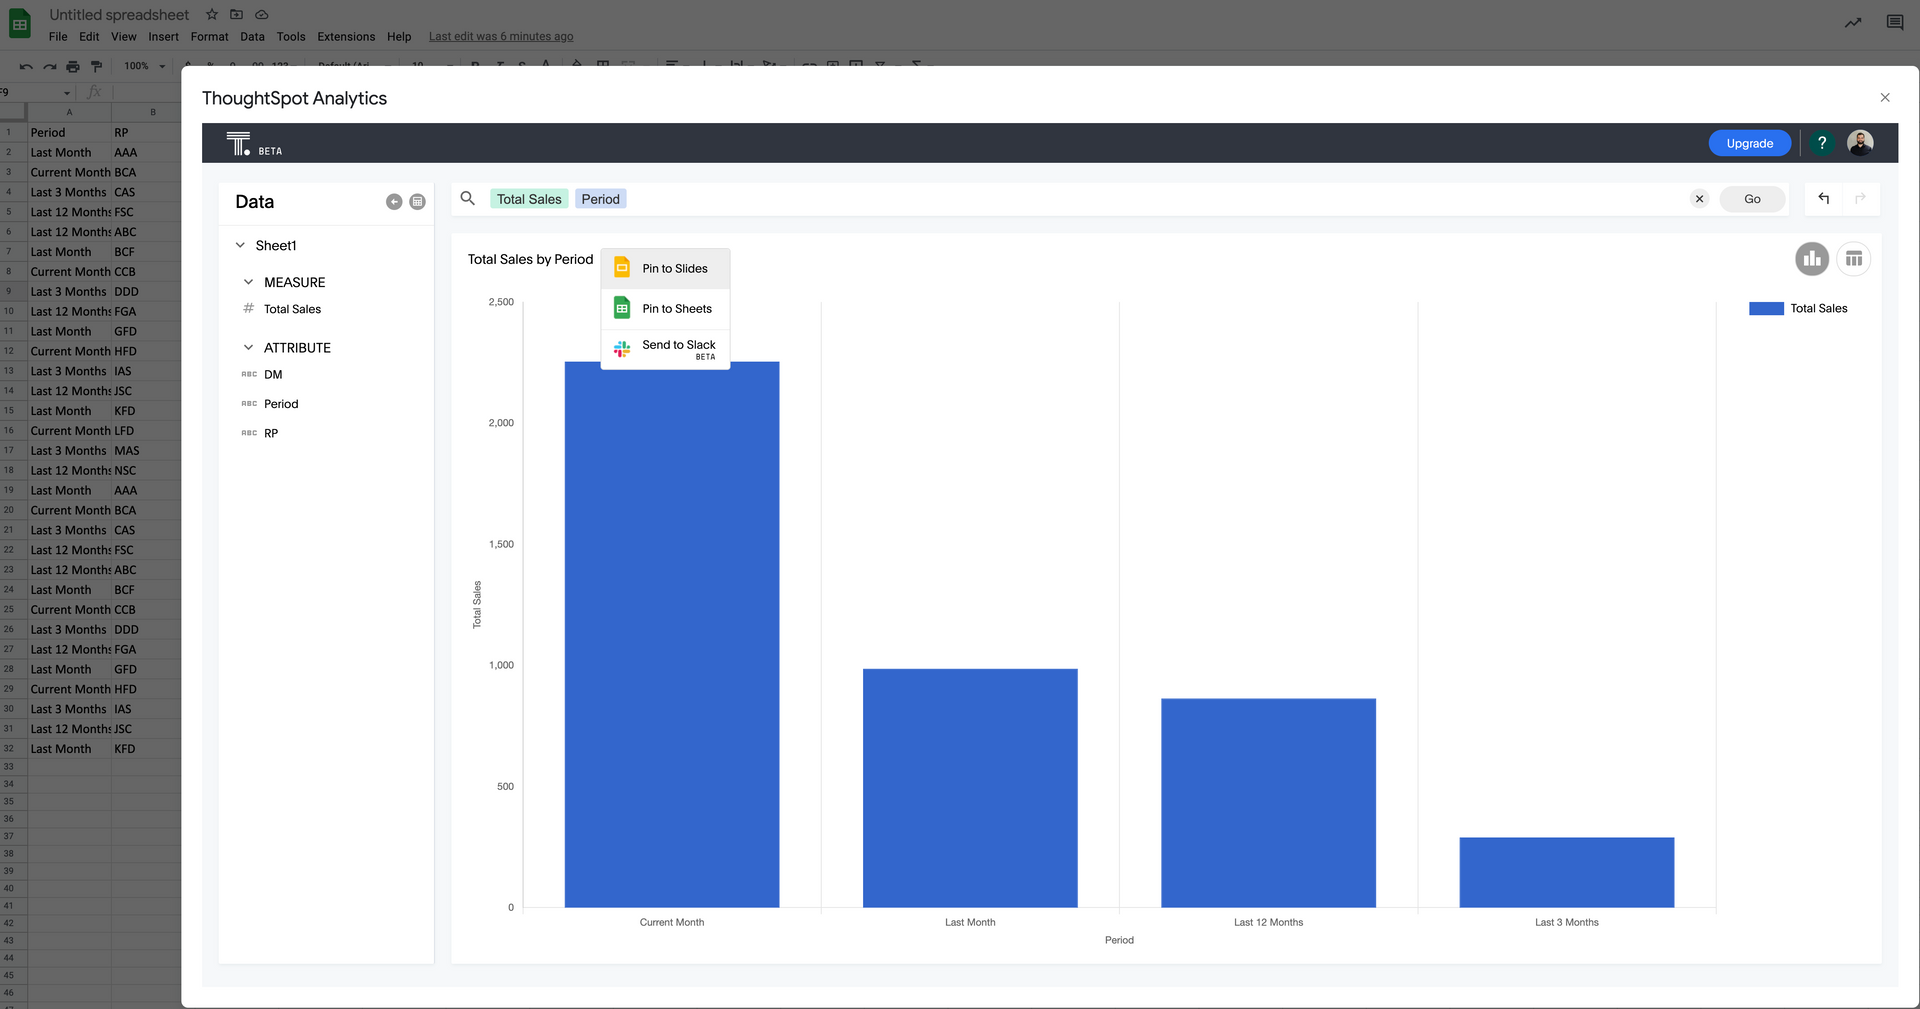
Let's see the results in an answer:


Now let's see how it works in a Liveboard:


You can be creative and use parameters to control aggregation types, and even combine multiple parameters to create more complex measures and attributes.


I hope it helps you.

By site-qvIZ7w 08 Mar, 2023
Enhance your google sheets with a ThoughtSpot extension for Free!
By site-qvIZ7w 03 Mar, 2023
Our journey begins...
By site-qvIZ7w 21 Feb, 2023
Once upon a time, in a land far, far away, there was a kingdom called "Data-topia". The citizens of Data-topia were keen on keeping track of all their activities and wanted to know everything happening in their kingdom. They were so obsessed with data that they even named their king "Data-licious"! One day, a group of brave adventurers embarked on a journey to explore the kingdom and create a project that could help the citizens make sense of all the data they had collected. They called themselves the "Data Busters," and their project was named "Data-saurus". The Data Busters traveled far and wide, collecting data from every corner of the kingdom. Unfortunately, they encountered many obstacles along the way, including a mischievous dragon who would constantly breathe fire on their spreadsheets and a group of trolls who would steal their charts and graphs. Despite these challenges, the Data Busters persevered and finally completed their project, which they called "Data-topia's Delight." The citizens of Data-topia were overjoyed with the new tool and threw a huge celebration in honor of the Data Busters. They even renamed the king "Data-mite"! And so, the Data Busters and their Data-Saurus lived happily ever after, continuing to help the citizens of Data-topia make sense of all their data and ensuring that the kingdom remained at the forefront of the data revolution. In this crazy, funny series, you will pick this new tool that the citizens of "Data-topia" used. I'll create a project from scratch, and with your help, we will identify the business requirements, data, reports, and dashboards that will be used in this project. Answer this pool to choose the destiny of this history. Choose wisely.
Share by: